Performance Battle: AnyView vs Group

I’ve recently received a question from an iOS engineer regarding my open source project written with SwiftUI. He shared his concerns regarding the use of AnyView in the project.
To quickly bring you on the same page, there are rumors (2, 3, 4, 5, 6) that AnyView brings in serious performance implications to the SwiftUI render engine, due to the fact that it erases the type of the underlying view hierarchy thus slowing down the diffing.
The documentation for AnyView says the following:
An AnyView allows changing the type of view used in a given view hierarchy. Whenever the type of view used with an AnyView changes, the old hierarchy is destroyed and a new hierarchy is created for the new type.
This sounds scary. Destroying and rebuilding the entire hierarchy? Oh boy!
But how often does the type of view change inside the AnyView? Probably not too often, unless you’re building an app for developing epilepsy.
If the type of view stays the same, but instead a subgraph of the hierarchy contained in AnyView receives an update, does it behave the same way? Spoiler: it doesn’t.
So what about the performance of diffing the type-erased hierarchy inside AnyView? Well, there were no benchmarking conducted by anyone from the community.
So in this MythBusters episode, we’ll find out:
- How
AnyViewperformance compares toConditionalView(akaGroup { if ... else ... }) - What are the costs of re-creating the view hierarchy
- What are the real performance bottlenecks in SwiftUI
- How to organize the hierarchy to assure the best performance
Let’s get started!
Preparing for the test
The most important part of the experiment is to pick the right toolkit and the test samples.
Obviously, we’d need a heavy-weight view carrying many elements to make the diffing harder.
The first variant I came up with was a simple grid of elements like so:
1
2
3
4
5
6
7
8
9
10
11
12
13
14
15
16
17
struct GridView: View {

    let rows: Int = 100
    let columns: Int = 100

    var body: some View {
        VStack(alignment: .center, spacing: 0) {
            ForEach(0 ..< self.rows) { row in
                HStack(alignment: .center, spacing: 0) {
                    ForEach(0 ..< self.columns) { column in
                        <Element View> // for example, Text("@")
                    }
                }
            }
        }
    }
}
But profiler quickly showed that SwiftUI is spending most of the time on… calculating the layout of this thing!
So after a few other attempts, I ended up with this template of the test view, that can contain an arbitrary number of elements with minimal layout required:
1
2
3
4
5
6
7
8
9
10
11
12
struct StackView: View {

    let count: Int = 10000

    var body: some View {
        ZStack {
            ForEach(0 ..< self.count) { index in
               <Element View> // for example, Text("@")
            }
        }
    }
}
Now, this StackView could be re-used in various tests, where <Element View> could be either static view, such as Text("@"), or a dynamic view that alters the content based on state parameters.
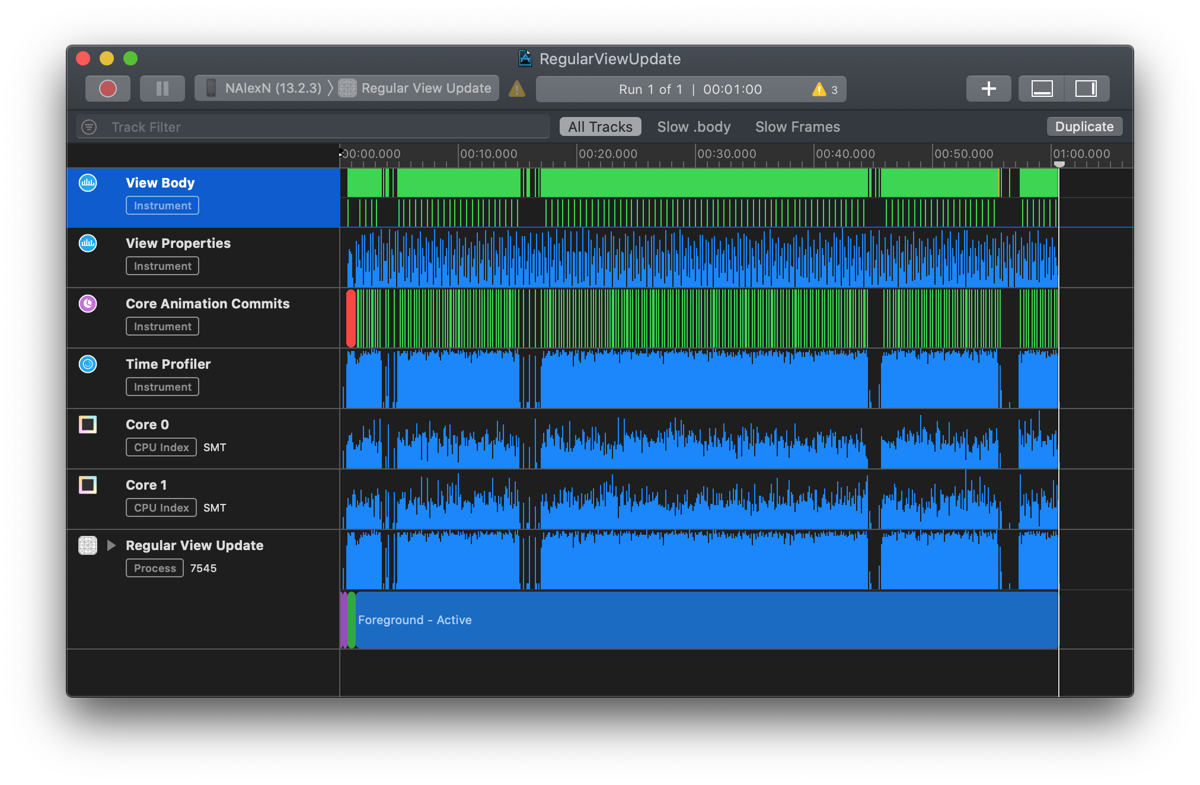
For measuring the performance I’ve used SwiftUI Profiler from Instruments, which shows lots of useful information, including functions time profiling, the number of times each body was called, and much more.
In order to see the performance when launching from Xcode, I’ve used a simple FPSView that was counting how many render cycles SwiftUI can carry under high load.
All the tests were running on iPhone 7 iOS 13.2.3 for a duration of 1 minute. The phone was lying on a refrigerant bag (was heating up like crazy without it).
Test #1: Constantly redrawn static content
It is obvious that SwiftUI does not constantly recalculate the view hierarchy when there are no changes to the state.
So in all the tests, I had to trigger the hierarchy update by Timer that was toggling a local @State var updateTrigger:
1
2
3
4
5
6
7
8
9
10
11
12
struct ContentView: View {

    private let updateTimer = Timer.timer(frequency: 60)
    @State private var updateTrigger = false

    var body: some View {
        <testView>
        .onReceive(self.updateTimer) { _ in
            self.updateTrigger.toggle()
        }
    }
}
The <testView>, in this case, was a static view containing 1600 Text views.
The test mechanics
SwiftUI hierarchy with ContentView in the root receives constant refresh requests at a rate of 60 times a second. This triggers the recalculation of the body, which contains a never-changing statically typed View with 1600 Text elements inside.
The test is running for 1 minute under SwiftUI Profiler. For determining the FPS, the FPSView is added to the ContentView’s body and the app is launched directly from Xcode.
Here are the results for the static content:
| Average FPS | ElementView Body Calls | Cumulative Body Calculation Time |
|---|---|---|
| 60 | 1600 | 70 ms |
As a bonus, here are the result for the same setup, but when every Text was wrapped in AnyView
| Average FPS | ElementView Body Calls | Cumulative Body Calculation Time |
|---|---|---|
| 60 | 1600 | 32 ms |
This is quite surprising, but wrapping element views in AnyView actually improved the performance of constructing the body by 50%, but had no visible effect on the diffing performance.
This is not a deal-breaker yet, because construction of the views was taking less than 0,1% of the time (total of 70ms for a 1-minute test).
In addition to the data from the profiler, I run a simple benchmarking in the code and found that creation of the test view with or without AnyView is taking between 3-4 nanoseconds:
1
2
3
4
5
6
7
let startTime = Date().timeIntervalSinceReferenceDate
for _ in 0 ... 1_000_000 {
    let view = StackView(count: 1600)
    _ = view.body
}
let endTime = Date().timeIntervalSinceReferenceDate
print("\(endTime - startTime)") // prints out "3.5399050..."
This means that the creation of the hierarchy is incredibly fast, SwiftUI is able to produce ~285k View structs a second! And don’t think that Text is a lightweight struct: reflection shows it has a quite complex inner structure for handling the string localization and formatting, and font modifiers, etc.
- Profiling file for
Text - Profiling file for
AnyView(Text)
Test #2: Tweaking one element inside a massive view
The purpose of this test was to see how SwiftUI can perform diffing of the hierarchy when 99.9% of content remains unchanged.
The <elementView> is a dynamic view capable of toggling the content between static Text and static Image. Underlying UIImage has a small size (6x10 pixels) and is cached in a static variable to assure the best performance.
Three variations of <elementView> were tested:
1. ConditionalView
1
2
3
4
5
6
7
8
9
var body: some View {
    Group {
        if <condition> {
            Image(...)
        } else {
            Text(...)
        }
    }
}
2. AnyView
1
2
3
4
5
6
7
var body: some View {
    if <condition> {
        return AnyView(Image(...))
    } else {
        return AnyView(Text(...))
    }
}
3. EquatableView
1
2
3
4
5
6
7
8
9
struct ElementView: Equatable {
    var body: some View { <same as for ConditionalView> }

    static func == (lhs: Self, rhs: Self) -> Bool {
        return true
    }
}

let view = ElementView().equatable()
The test mechanics
SwiftUI hierarchy receives constant refresh requests at a rate of 60 times a second. The hierarchy contains 1600 ElementViews able to toggle between Text and Image based on a Binding parameter they receive upon initialization.
The test is constructed in a way that only one ElementView has to constantly toggle between Text and Image, while others stay Text all the time. Since all ElementViews are hooked on the update from Binding, it’s the job of the SwiftUI engine to properly run diffing of all 1600 views for optimal rendering.
The average time for calling .init() + .body for the test view is again ~4 nanoseconds.
The results for ConditionalView :
| Average FPS | ElementView Body Calls | Cumulative Body Calculation Time |
|---|---|---|
| 10 | 355,000 | 2180 ms |
The results for AnyView :
| Average FPS | ElementView Body Calls | Cumulative Body Calculation Time |
|---|---|---|
| 10 | 355,000 | 2130 ms |
The results for EquatableView:
| Average FPS | ElementView Body Calls | Cumulative Body Calculation Time |
|---|---|---|
| 18 | 440,000 | 2640 ms |
Pretty interesting results. Here are the observations we need to note:
- The performance of diffing the content for
ConditionalViewandAnyViewis practically the same, based on the FPS. EquatableViewalmost doubled the FPS compared to the other two. Because of this SwiftUI was able to run more render cycles in the allocated minute, resulting in a higher number of body calls and calculation time.- From the syntax of
ConditionalViewthere may be an illusion that views for “true” and “false” branches are both cached. This is not true - the reflection shows that only one view gets cached at a time. The results of the experiment correspond with this fact: the cumulative body calculation time forAnyViewandConditionalViewis about the same. BothAnyViewandConditionalVieware re-creating the inner hierarchy when the type of view changes. - In order to compare two hierarchies of views, the other one has to be created. Yes, we thought the worst thing that may happen is the re-creation of the hierarchy, but SwiftUI is doing this all the time for calculation of the diff. We can help it by making the view
Equatableand wrapping it insideEquatableView. This way SwiftUI does not have to call the computed variablebodyfor identifying if the content has changed or not.
- Profiling file for
ConditionalView - Profiling file for
AnyView - Profiling file for
EquatableView
Test #3: Toggle between two static massive views
This is the last challenge in the battle of AnyView and ConditionalView.
We have two static massive views of different inner structures and types.
The job of the AnyView and ConditionalView is to toggle between these two views at the highest possible rate.
This way we can find out if content switching inside ConditionalView is more performant than “destroying and re-building the view hierarchy” by AnyView.
The test mechanics
In the setup, we have two never-changing massive views, both containing 225 elements of types Text and Image respectively.
The code for testing ConditionalView and AnyView:
1
2
3
4
5
6
7
8
9
10
11
12
13
14
15
16
17
var testConditionalView: some View {
    Group {
        if <condition> {
            TextStackView(count: 225)
        } else {
            ImageStackView(count: 225)
        }
    }
}

var testAnyView: some View {
    if <condition> {
        return AnyView(TextStackView(count: 225))
    } else {
        return AnyView(ImageStackView(count: 225))
    }
}
The <condition> is toggled by Timer a rate of 60 times a second.
The results for ConditionalView
| Average FPS | ElementView Body Calls | Cumulative Body Calculation Time |
|---|---|---|
| 18 | 244,000 | 1450 ms |
The results for AnyView
| Average FPS | ElementView Body Calls | Cumulative Body Calculation Time |
|---|---|---|
| 20 | 255,000 | 1430 ms |
Who placed the bet on ConditionalView? I guess, most of us did…
But it turns out that ConditionalView not only cannot beat AnyView, it is even a bit slower: in these two tests, SwiftUI was able to perform by 5% more render cycles for AnyView than for Group!
You can compare the profiling files:
- Profiling file for
ConditionalView - Profiling file for
AnyView
Conclusion
I cannot say there is a clear leader among AnyView and ConditionalView, but the myth about negative AnyView performance implication is BUSTED.
This was tested on micro views, as well as on massive views: AnyView does not slow down the diffing for tiny updates, but actually performs better with major content changes.
Based on the condition in the if, the ConditionalView does cache only one contained view. So practically it destroys and recreates the content just like AnyView does.
There is no reason to fear the words “old hierarchy is destroyed and a new hierarchy is created”. The re-creation of the SwiftUI view hierarchy is practically free. In fact, the SwiftUI engine does create a new sub-hierarchy every time for comparing the content. You cannot compare A to B without creating B, right?
The real performance bottleneck turns out to be the inner layout system of SwiftUI. I’m sure this will be optimized later, but for now, we just need to make sure to bind the state as low as possible in the hierarchy, so that SwiftUI had to recalculate only the small subgraphs of the hierarchy.
When you access a Binding, @State, @ObservedObject or @EnvironmentObject from the view’s body, SwiftUI associates this view with any updates of that state. Even if the body returns the same result as before - SwiftUI recalculates the layout regardless.
One of the ways to improve the performance is to use EquatableView, which allows SwiftUI to take a shortcut and not call the body if your view says it did not change.
And finally: Premature optimization is the root of all evil. Use SwiftUI Profiler in the Instruments for locating the real performance bottleneck instead of guessing, and don’t trade the code clarity for a couple of nanoseconds of performance advantage.
The source code for the project can be found on GitHub.
Let's connect!
Subscribe to RSS feed or follow my Twitter for the new articles alerts. And let's connect on LinkedIn as well!